- Build the Future
- Posts
- Exports, Imports and Tech
Exports, Imports and Tech
To continue to lead in international trade, you need to continue to innovate in deep tech
Mark Stevenson
July 05, 2024
On average, about $69 billion of goods and services are traded internationally every day. Look around any major economic centre, and you’ll see the incessant flow of containers transported across the seas by ever larger container ships, over land by rail and truck and in vans for the last mile delivery. Or you’ll see the skyscraper offices of a global service industry. All of this together gives us exports and imports.
Every nation wants to boost exports to increase GDP, create more jobs, and bring money into the country. Every country wants to rely on imports to increase consumer choice and lower costs. Of course, to import and export, a nation needs businesses that produce goods and services that people globally want to buy; and it needs companies that are integral to global supply chains. I’m happy to say that the UK has both.
In 2023, our biggest export market was the United States, which was the destination of 22.1% of all exports (£191.5 billion). Then we have a collection of European neighbours, Germany (£60.8 billion), Ireland (£57.4 billion), Netherlands (£53.6 billion) and France (£45 billion). Our next largest export partner is China with £31.5 billion worth of exports.
Rank | Export Destination | £ billion | % of total |
1 | United States | 191.5 | 22.1 |
2 | Germany | 60.8 | 7.0 |
3 | Ireland | 57.4 | 6.6 |
4 | Netherlands | 53.6 | 6.2 |
5 | France | 45.0 | 5.2 |
6 | China | 31.5 | 3.6 |
7 | Switzerland | 31.2 | 3.6 |
8 | Belgium | 25.9 | 3.0 |
9 | Spain | 19.9 | 2.3 |
10 | Italy | 18.5 | 2.1 |
58.7% of the UK’s exports go to non-EU countries, so there is plenty of scope to grow exports to developing and increasingly wealthy countries, especially in Asia.
The United States is the source of most of our imports, with the UK importing £119 billion worth of goods and services from the US, accounting for 13.3% of all imports. The rest of the top ten import sources is dominated by our European neighbours with the exception of China.
Rank | Import Source | £ billion | % of total |
1 | United States | 119.4 | 13.3 |
2 | Germany | 89.2 | 9.9 |
3 | Netherlands | 65.1 | 7.2 |
4 | France | 60.2 | 6.7 |
5 | China | 58.8 | 6.5 |
6 | Spain | 44.2 | 4.9 |
7 | Italy | 32.4 | 3.6 |
8 | Ireland | 32.0 | 3.6 |
9 | Belgium | 31.9 | 3.6 |
10 | Norway | 30.2 | 3.4 |
However, unlike our exports, we are slightly more reliant on the EU for our imports, with 51.9% of our imports originating from EU countries.
When we break this down further, we begin to see some interesting patterns. We import more goods from Germany than any other nation (£73.8 billion, 12.7% of the total), reflecting where the economic strength of the German economy lies, whereas we import a similar amount of goods (£57.8 billion) and services (£61.6 billion) from the USA.
Ideally, a nation has diversified import and export markets and is not overly dependent on any one nation, although, as with everything else, you’ll get a skewed distribution, so you’ll have larger trade volumes with your biggest trading partners.
We have the biggest trade deficits in goods and services with Germany (£28.4 billion), China (£27.3 billion), Spain (£24.3 billion) and Norway (£20.9 billion).
Rank | Country | Deficit £ billion |
1 | Germany | -28.4 |
2 | China | -27.3 |
3 | Spain | -24.3 |
4 | Norway | -20.9 |
5 | France | -15.2 |
6 | Italy | -13.8 |
7 | Netherlands | -11.5 |
8 | Poland | -9.8 |
9 | India | -7.3 |
10 | Turkey | -6.1 |
But we have a huge trade surplus in goods and services with the United States (£72.1 billion) and Ireland (£25.4 billion), and then a long list of smaller countries, which generally correlate to where we export services, as the UK is a country with a sizeable economic expertise in services.
Rank | Country | Surplus £ billion |
1 | United States | 72.1 |
2 | Ireland | 25.4 |
3 | Switzerland | 11.6 |
4 | Australia | 9.3 |
5 | Saudi Arabia | 8.9 |
6 | Singapore | 7.5 |
7 | Canada | 6.7 |
8 | Hong Kong | 5.9 |
9 | Luxembourg | 4.6 |
10 | United Arab Emirates | 4.5 |
Our largest trading partner in 2023 is the United States, which accounts for £310.8 billion worth of trade (17.6% of total trade). Germany is our next largest trading partner (£149.9 billion, 8.5%). 53.3% (£939.4 billion) of total trade is with nations outside of the EU, with 46.7% with EU nations (£823.1 billion). This gives the UK a trade deficit of £33.4 billion, which, except for 2020, has continued the trend of UK trade deficits since 1998. However, this deficit is driven by a deficit in goods, which has occurred every year since 1983, but the UK has a trade surplus in services, which has been the case since 1966.
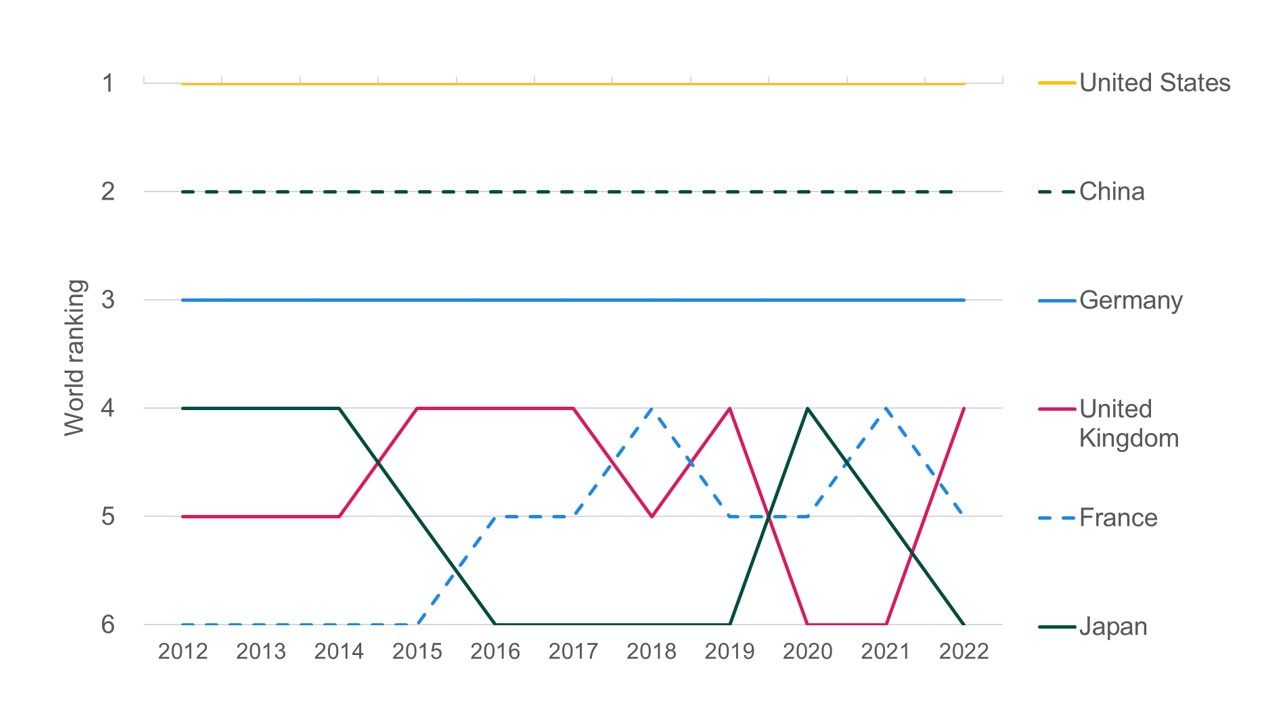
The UK is a major player in global trade which the same group of large countries dominates over time. This aligns closely with the strongest and largest world economies, which, even with the recent trend of onshoring and nearshoring, are still, and will continue to be, interconnected in a highly globalised economic system.
These large economies are highly connected not only through the trade of goods and services but also through foreign direct investment (FDI).
The special economic relationship between the UK and the US is further demonstrated by the fact that the United States ranked first in FDI stock into the UK in 2021, at £675.7 billion, representing 33.7% of total inward FDI stock. The United States was the top destination for outward FDI stock in 2021, at £461.4 billion, representing 26.1% of total outward FDI stock.
In 2022, the world's top three countries for inward investment were the USA, China and the UK. The UK was the fourth largest global investor in 2022, behind the USA, the Netherlands and China. Unsurprisingly, the USA, China and the UK rank as the top three in venture capital investment in 2024. The USA leads the way with $80 billion, followed by China at $21.3 billion and the UK with $8.3 billion.
There are differences: the United States and the UK’s VC money is generally market led, and deployed where firms believe the best chance of future returns lies. Chinese VC investment is more governed by national industrial policy, although the destination is often the same: the enterprise software industry and artificial intelligence. Differences exist though, the United States and China have a autonomous and electric vehicle industry, whilst the UK doesn’t. China invests heavily in robotics and manufacturing automation. The UK and China have thriving fintech ecosystems in a way that the fragmented US financial services system doesn’t - although the US has some notable private companies in fintech, such as Stripe.
However, what all economy builders in all three nations do well is recognise the underlying economic truth: to grow and to continue to lead in international trade, you need to continue to innovate in deep tech. This has always been the case. During the Cold War, the USSR even built a new city, Zelenograd, to be the economic centre of microelectronics and computing (for both economic and national security reasons). Of course, like all economic central planning, it didn’t work.
The UK economy has been technology led since the Industrial Revolution, and the US, especially Silicon Valley has been the home of the global technology industry for at least the last forty years. But nurturing, embracing and growing a tech industry has been key to the rise of new economic superpowers.
The Japanese economy saw the rise of the technology industry through the rise of consumer electronics (companies like Sony, Sharp and Panasonic) and the car industry (companies like Toyota, Honda and Nissan), followed by innovation and economic power in robotics, semiconductors and telecoms.
Over the course of 30 years, the Chinese economy has developed and changed beyond all recognition. It is increasingly powered by an industrial policy designed to allow the Chinese economy to become the dominant technological superpower, which is how major technology centres in Beijing (finance), Shenzhen (hardware), Shanghai (fintech and ecommerce), Hangzhou (home to Alibaba), Guangzhou (manufacturing and software) and Chengdu (electronics and IT) exist.
It’ll continue to be the technology industry and its numerous applications across industry sectors that power the imports and exports of the UK and the world.
Reply